2021 Year-End Macro Model
In the CHG lexicon a model is a descriptive framework for organizing information. The purpose of this document is to organize the most relevant information the major macro markets (Equities, Rates, FX, and Commodities) from the past year to provide a framework from which one can start the decision-making process.
Overview
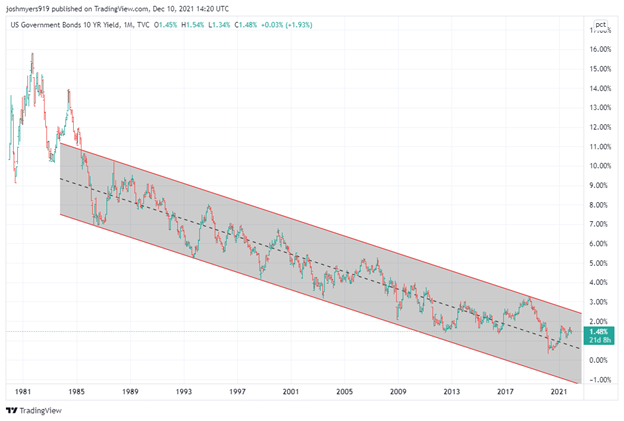
It all starts with the long-term downward trend in interest rates. This 30+ year secular trend influences everything in the financial markets and has generally led to a broad rise in asset prices.
Overview
It all starts with the long-term downward trend in interest rates. This 30+ year secular trend influences everything in the financial markets and has generally led to a broad rise in asset prices.
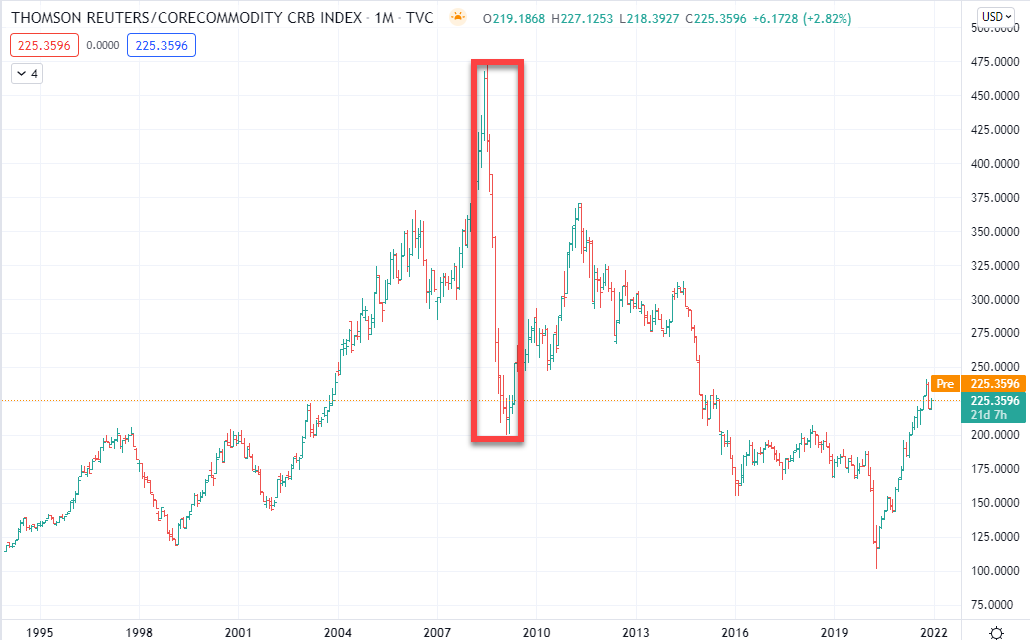
Lower interest rates have been disinflationary as they have increased supply. We only have data back to 1995 for the CRB Commodity Index but it shows a market that has gone nowhere for nearly 30 years.
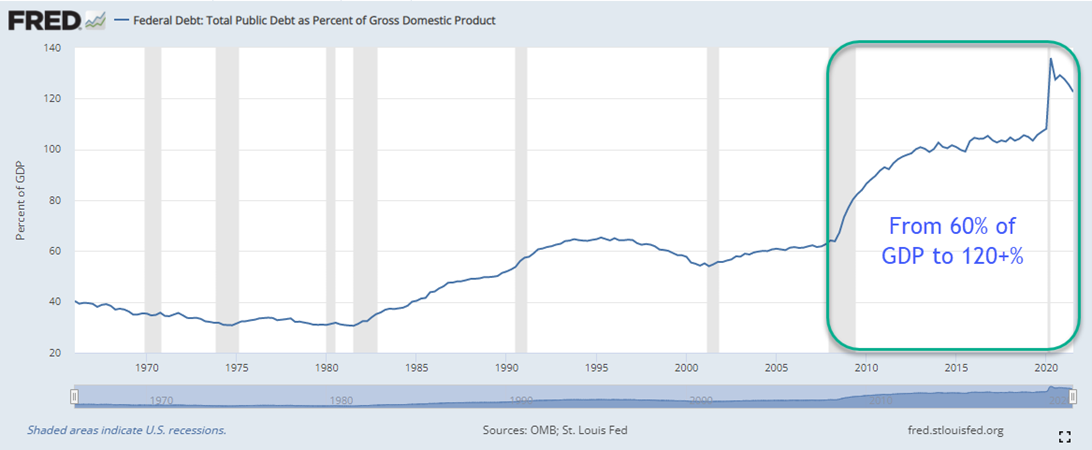
The GFC in 2008-2009 set off the disinflationary aspect of lower interest rates. As the Fed and Congress stepped in to support the economy and Federal Debt as a percentage of GDP began to rise rapidly. This has contributed to the disinflationary environment (see Hoisington).
This has been the narrative that has dominated the markets since the GFC. Initially, lower US interest rates kept the dollar low but after the BOJ embarked on their currency devaluation in 2014-2015 the dollar moved up to a new trading range that it has been stuck in ever since.
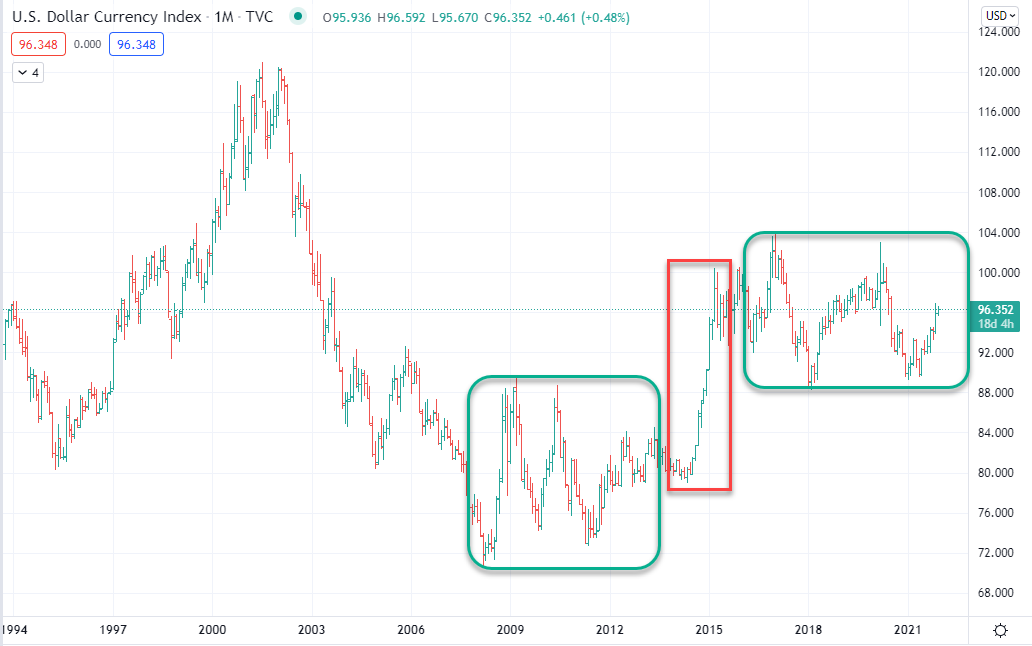
The dollar was threatening to break out lower from this range early in 2021 after the Capitol Invasion and Georgia Runoff elections which initially made it seem like the Biden Administration would have a broader mandate than the initial election results. However, after their spending plans fell flat in Congress the worries about fiscal profligacy faded and the dollar rallied as the market began to price in Fed tightening as CPI began to increase.
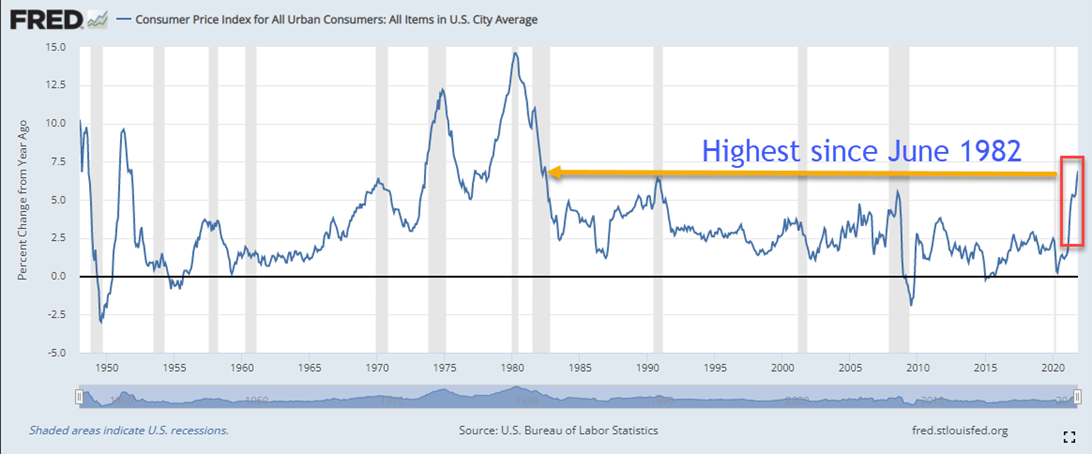
Once the Fed indicated they were “talking about talking about” tapering the market started to price in interest rate increases. This flattened the yield curve as normally happens when the Fed starts to increase interest rates.

Equities
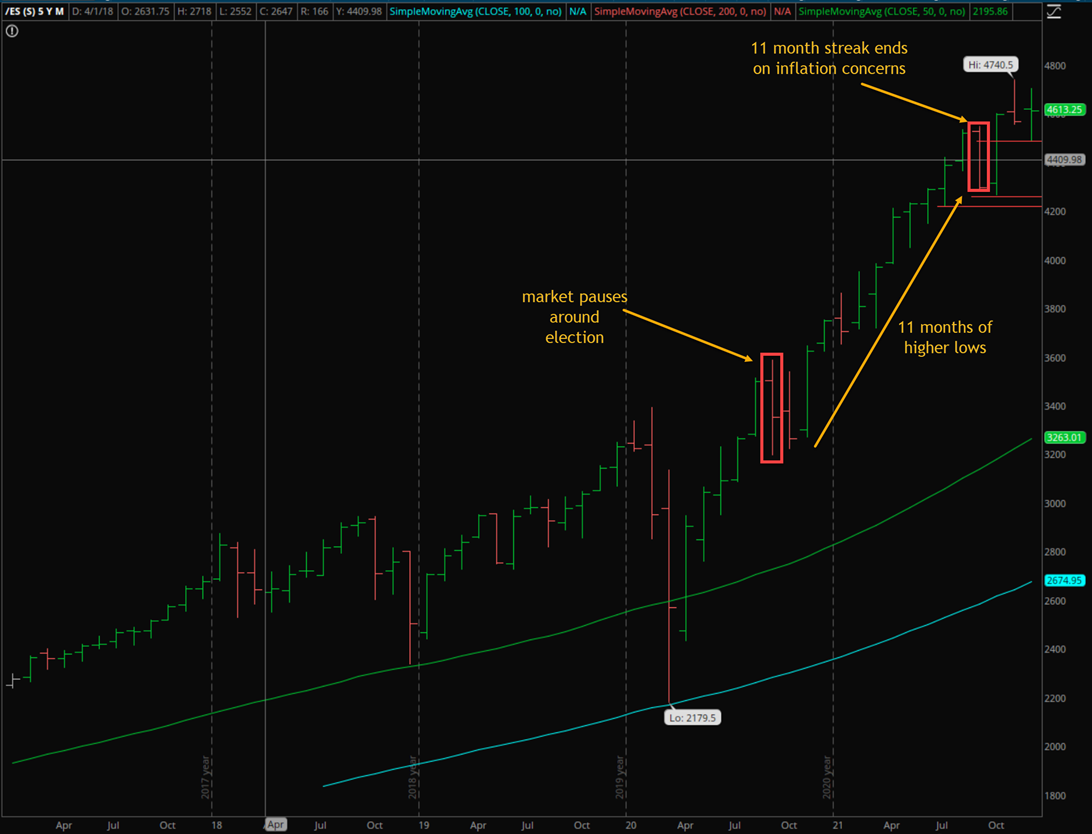
The impact on the equity market has been muted thus far as the expectations of Fed tightening and its impact on inflation has increased uncertainty and caused the post-COVID upward trend to pause and the market has entered a four-month trading range. Equities were one of the only asset classes to be in a sustained trend in 2021.
The impact on the equity market has been muted thus far as the expectations of Fed tightening and its impact on inflation has increased uncertainty and caused the post-COVID upward trend to pause and the market has entered a four-month trading range. Equities were one of the only asset classes to be in a sustained trend in 2021.
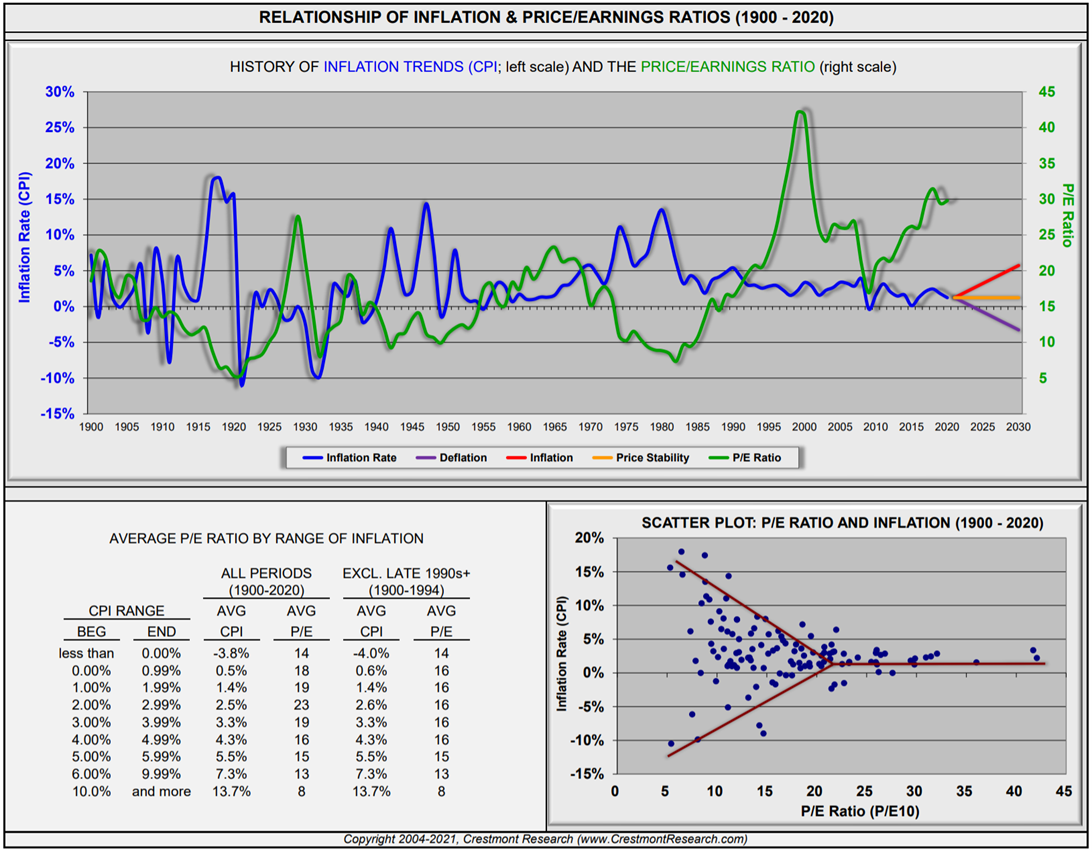
The outcomes of Fed policy and inflation will have an impact on US equity market returns. Current valuations are historically high and supported by low interest rates and inflation. The analysis below shows that these high valuations require low but positive inflation to maintain current multiples. Inflation or Deflation could cause a drop in PE multiples.
Fed policy has a large impact on the financial markets and the outcome of their plan to taper asset purchases and raise interest rates will impact interest rates, commodities, the dollar, and equities. The post-GFC pattern of disinflation could persist which would support current US equity market valuations. However, inflation or deflation could also result from either an overly restrictive Fed or an overly accommodative Fed. The yield curve tends to be the best leading indicator for Fed policy.
US Treasuries
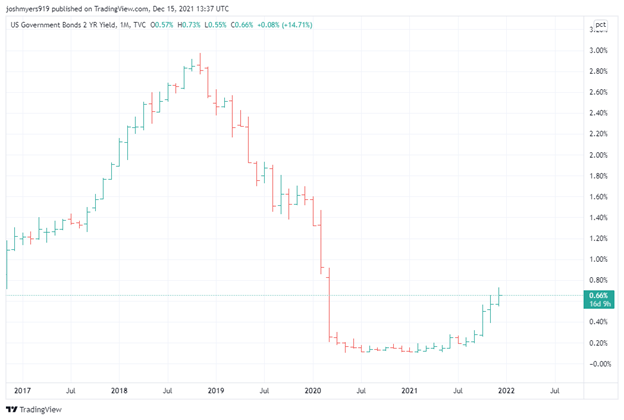
The two-year has embarked on a new upward cycle which started in June 2021. The market is trending higher for the past four months. Monitoring this trend for continuation will be a focal point for determining the shape of the yield curve.
US Treasuries
The two-year has embarked on a new upward cycle which started in June 2021. The market is trending higher for the past four months. Monitoring this trend for continuation will be a focal point for determining the shape of the yield curve.
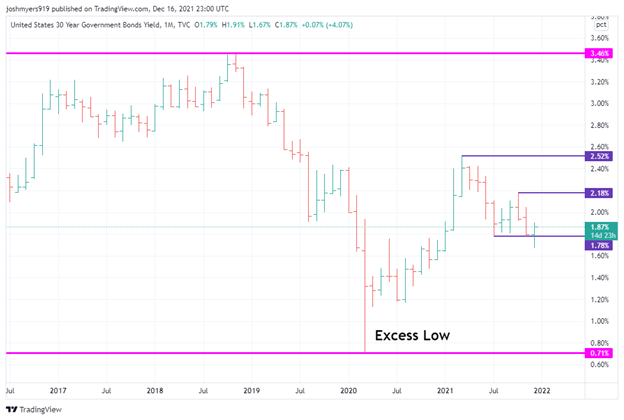
The long end of the curve has been a different story. After finding an excess low during COVID, longer-term rates started a new upward cycle which has paused starting in March 2021, and brought the market into a short-term trading range. The March high came about when it seemed like the Biden Administration was in a full embrace of MMT policies and the dollar was attempting to breakout lower. The market reversed off that sentiment extreme and when the Fed told us they were thinking about tapering in June the range narrowed further as growth and inflation expectations were lowered and the curve really started to flatten. After making the excess low in March 2020 the expectation would have been to revisit the prior high of 3.46%, however the market got ahead of itself earlier this year and has coming into a trading range that is compressing. As the first chart of this report showed the secular trend is still lower for interest rates, however there is a chance the COVID excess low may have marked the secular low for that cycle.
FX
The chart of the Euro looks strikingly like the chart of 30-year US yields.
The chart of the Euro looks strikingly like the chart of 30-year US yields.
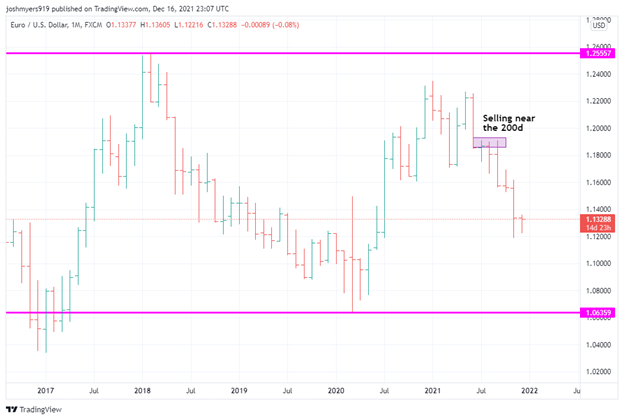
Since the shift in June the Euro has been trending lower but is still in the middle of this four-year trading range after failing to reach the 1.25a prior high. If this trend continues, the 1.05a area would be the natural destination and if the Euro cannot find acceptance below that level then it would increase the odds of reversing back to the 1.25a trading range high. The last time the Euro rallied up to 1.25a was when the Fed was tightening, and the ECB was doing QE. Relative growth and monetary policies will determine whether the trading range holds. The most recent move lower was driven by sellers selling near the 200-day moving average; consistent and exacting selling like that near a widely known reference is not likely to be real money selling.
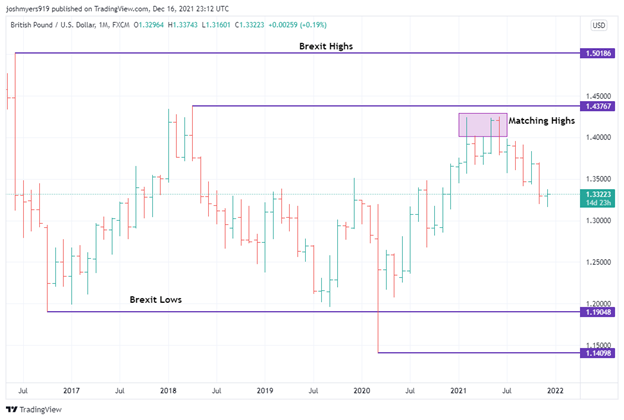
It is a similar story for the Pound except that the BoE was the first major central bank to raise rates this cycle and if that is going to lead to meaningful change for the currency it would move back above the November high of 1.37 otherwise the trend lower is likely to continue which targets the 1.19a Brexit lows. Tighter monetary policy leading to currency weakness is another feature of the post-GFC disinflationary trade where growth differentials matter more than interest differentials partly due to interest rates being near or below zero.
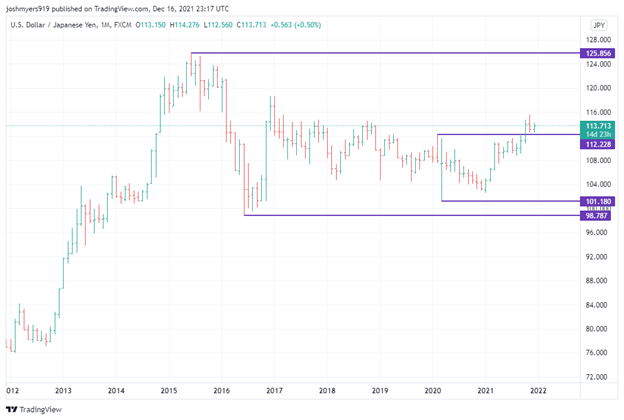
The Yen has been stuck in an ever-narrowing trading range since 2016. That range compressed further around COVID and only recently has the dollar broken out higher against the Yen on the back of Fed tightening expectations and higher risk aversion. If this breakout can continue it targets the 125a, if it returns to the range the opposite low would be the destination.
Commodities
After trading at deeply negative prices during the COVID panic crude oil rebounded and rallied for eight consecutive months after the 2020 election. That rally ended in August when it traded below the prior month low for the time this year. After that brief reversal crude spiked higher over the next two months before reversing lower again. Crude oil has now come into a five-month trading range as it awaits further information about the impact of Fed tightening on growth. If crude oil can re-establish itself and find acceptance above the $77a low from 2012 that would put it in the upper trading range which would target $100a and potentially the previous highs. If it cannot expect crude oil to remain in the $40a-$77a trading range.
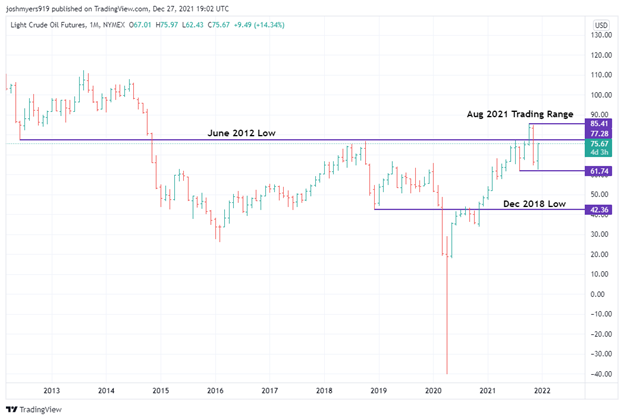
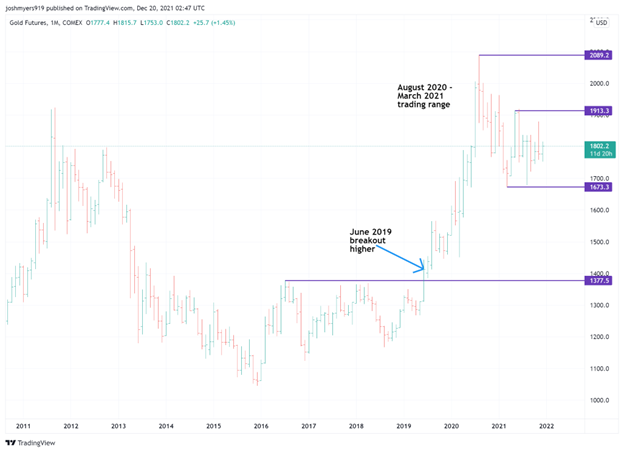
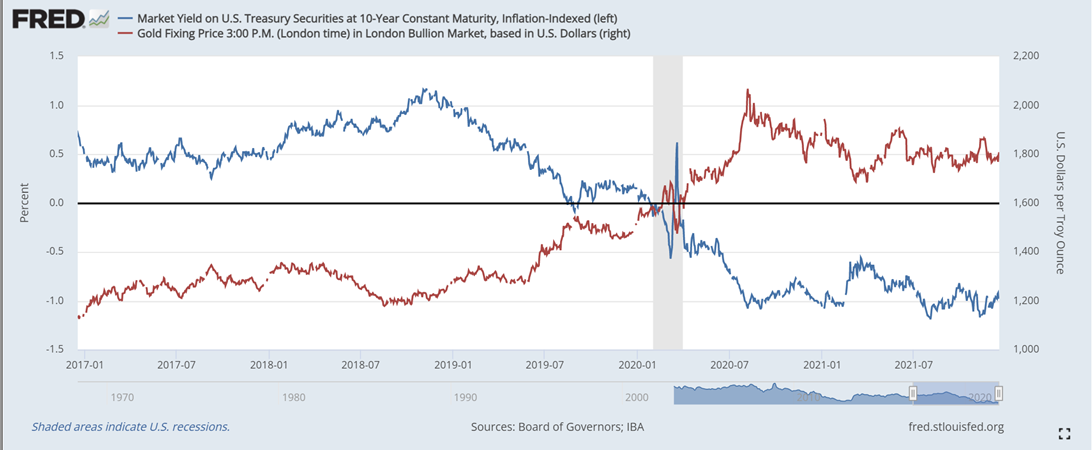
Gold has been in a narrowing trading range since making an all-time high in August 2020. The breakout higher in June 2019 started a new trend higher which may have found an excess high in August 2020. The resolution of this trading range will determine whether the trend sees continuation or if it is complete. The range has been compressing over the past few months which may lead to a directional breakout that can be sustained, otherwise the range will continue to compress. Gold has been increasingly trading with real rates which means its fate will be tied to the outcome for inflation, monetary policy, the yield curve, and interest rates.
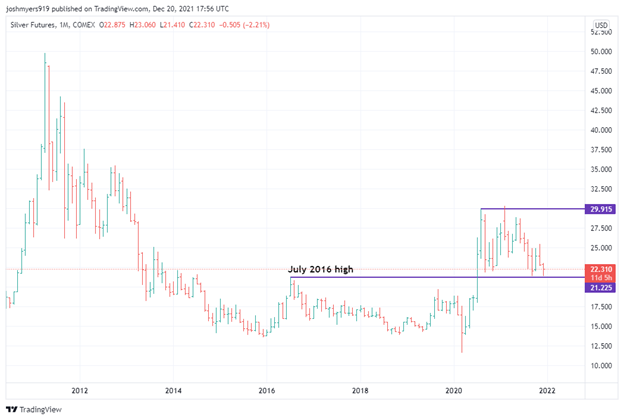
Silver broke out higher from multi-year trading range in July 2020 when monetary policy in the wake of COVID was very loose, the dollar was falling, and precious metals were rallying. Due to overly speculative longs and the indecisive trading range that gold entered, silver has not found continuation higher and has formed a trading range between the prior high from July 2016 and the $30a that was achieved in the height of the speculative frenzy earlier this year from the r/WSB crowd. If the breakout higher does not hold and the market finds acceptance below the $21a then returning to the prior range lows in the lm-teens becomes the target. If silver can find acceptance above the $30a then it targets $35 and eventually the prior highs around $50.
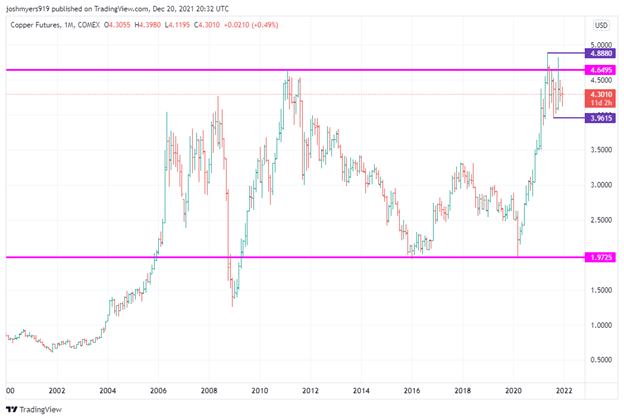
Copper saw a strong trend higher from the COVID lows to look above the prior cycle highs only to come back below and consolidate for the second half of 2021 as growth expectations were tempered due to expectations for Fed tightening. The market has coming into a trading range between the 3.96a and 4.90a. A breakout higher will be a positive sign for growth and inflation and continue the post-COVID inflationary trade we initially saw. A breakout lower will maintain the longer-term range and signal no change to the long-term disinflationary trend. Copper could have some signaling quality along with the 2-year treasury yield.
We have seen a similar pattern across the agricultural complex with a strong rally from the COVID lows, a failure at or near the prior cycle highs followed by a trading range. Since inflation is a focus for the markets, the commodity markets may provide valuable signaling for inflationary or disinflationary developments.
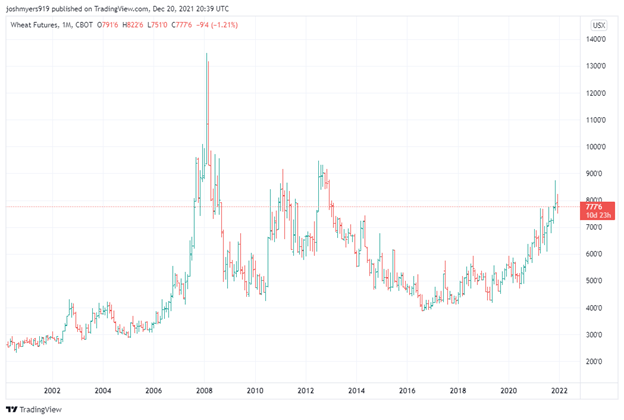
Wheat is in the strongest upward trend which started in 2016 and was not overly impacted during COVID. This trend has been steady and has not gotten too stretched out which is a sign of a healthy upward trending market. Upside targets to monitor for continuation of this trend would be the 2012 highs and the 2008 highs. Moving above these levels and finding acceptance and continuation would increase the odds that we have entered a new inflationary cycle.
Wheat is in the strongest upward trend which started in 2016 and was not overly impacted during COVID. This trend has been steady and has not gotten too stretched out which is a sign of a healthy upward trending market. Upside targets to monitor for continuation of this trend would be the 2012 highs and the 2008 highs. Moving above these levels and finding acceptance and continuation would increase the odds that we have entered a new inflationary cycle.
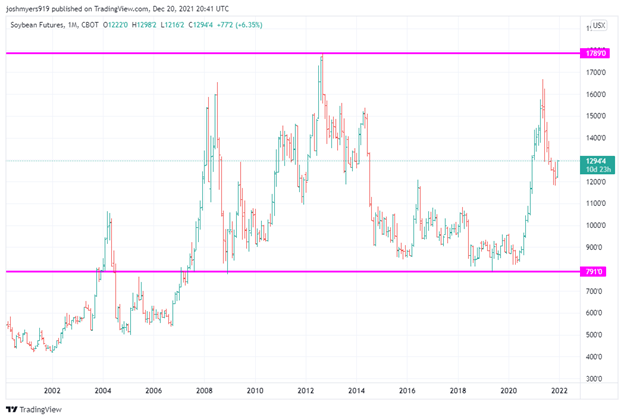
Soybeans continue to be stuck in their long-term trading range and despite a strong post-COVID rally, have not been able to show meaningful acceptance or continuation to threaten a breakout higher.
Corn shows a similar picture.

Conclusions
There are not many strong trends present in the markets at the moment. Most markets are in some form for short-term trading range which is a signal that they are awaiting additional information before finding directional conviction. That additional information could be anything but is very much focused on inflation and Fed policy currently. Certain commodities and the two-year treasury yield have the best signaling quality for developments along these fronts. The increase in commodity prices in 2021 was strong and led to the increase in inflation that we experienced in 2021, but the price increases have not meaningfully changed the longer-term disinflationary trend yet. If these commodities can find acceptance and continuation above their longer-term highs, then inflation may not be transitory and interest rates and Fed policy may adjust accordingly. Directional conviction and confidence are low in the markets as we head in 2022.
There are not many strong trends present in the markets at the moment. Most markets are in some form for short-term trading range which is a signal that they are awaiting additional information before finding directional conviction. That additional information could be anything but is very much focused on inflation and Fed policy currently. Certain commodities and the two-year treasury yield have the best signaling quality for developments along these fronts. The increase in commodity prices in 2021 was strong and led to the increase in inflation that we experienced in 2021, but the price increases have not meaningfully changed the longer-term disinflationary trend yet. If these commodities can find acceptance and continuation above their longer-term highs, then inflation may not be transitory and interest rates and Fed policy may adjust accordingly. Directional conviction and confidence are low in the markets as we head in 2022.
Your support for Cedars Hill Group is appreciated