Overview
Instead of a expending energy on an unproductive forecast for the New Year, every year we compile a framework for what has transpired in the past year to use as a baseline to measure change in the New Year.
The markets can be thought of as volatile expectations which are expressed in market prices that move around intrinsic value which is slower moving but challenging to measure. "Value is in the eye of the beholder" so there is not one single true measure of value that the market tries to guess, but we do find market participants frequently betting on outcomes such as economic recessions and monetary policy.
This has been the predominant theme in the markets for 2023. We came into the year with consensus expectations for a recession that never materialized. All year long the market has been pricing in the end of the Fed tightening cycle and the beginning of an easing cycle. As reality turned out differently from expectations the timing and magnitude of Fed rate cuts changed, but the overall expectation of slower growth and rate cuts has not.
This lack of change has led many markets to range-bound trading during 2023 and as we enter 2024 many markets are near the extremes of these ranges as the consensus is now, once again, convinced we are nearing the beginning of a rate cutting cycle. The direction is not in question, only the timing and the magnitude of cuts.
2-Year US Treasuries
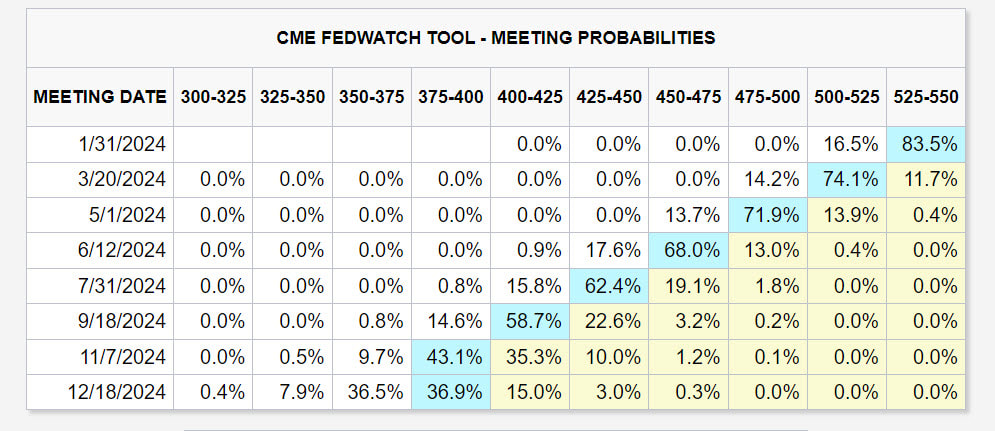
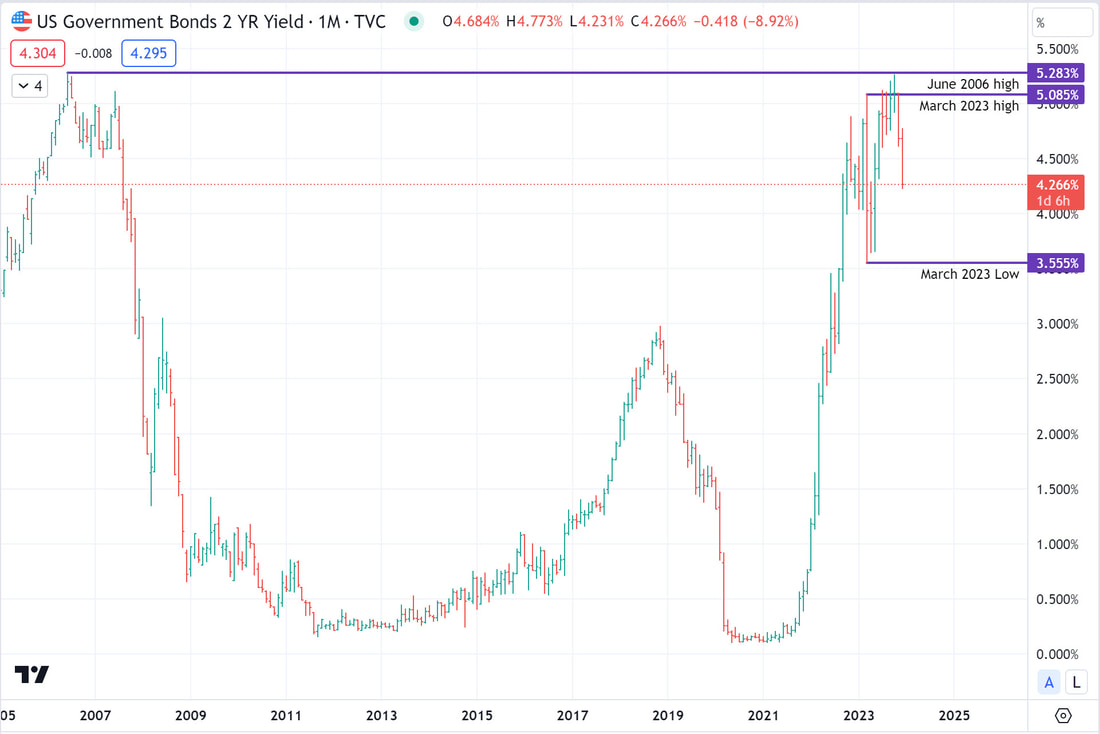
In last year's model we noted that the trend higher in two-year yields had shown the first indication of slowing down and as 2023 unfolded the two-year continued to show signs that the Fed was done hiking rates but has yet to decide what the next directional move will be. As we mentioned in the overview the market is expecting mean reversion by pricing in a rate cutting cycle after a rate hiking cycle. This conforms with the historical patterns around a traditional business cycle which is not something we have seen since before the GFC. The market is currently pricing in ~150bps of rate cuts in 2024:
The two-year yield has been within a rough 150bps range defined by the high and low from the regional bank panic in March 2023. Recently the market attempted an upside breakout that has failed with the current yield almost exactly at the mid-point of this range. Uncertainty remains very high around monetary policy and short-term rates which are highly dependent on how the business cycle plays out in 2024.
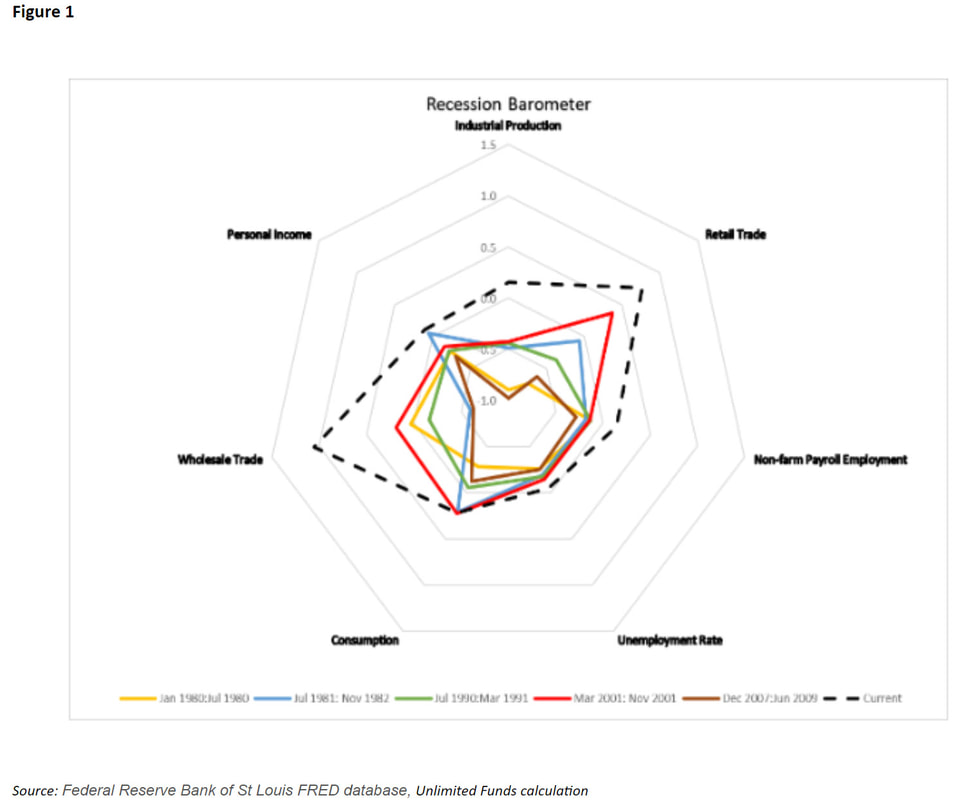
Current economic conditions show that the economy has weakened but is not as weak as it has been in prior recessions (see below). Unlimited, co-founded by ex-Bridgewater executive Bob Elliott, has built a recession probability model that shows a 30% probability of recession based on these measures. Jeff Gundlach forecasts that the unemployment rate will increase in 2024 and his inflation model forecasts that inflation will come down which aligns with the current market forward pricing. This contrast is a perfect example of the market's expectations moving around the economic reality. We could experience a realization of market expectations if we see Gundlach's forecast come true or if the economy enters recession in 2024. We could also see this divergence between reality and expectations narrow if the economy remains resilient and market expectations change. Bob Elliott adds one further consideration which is that current market pricing has lowered the cost of capital which is stimulative for economic growth; this point is the most difficult consideration which is always present in a reflexive and complex system like the economy and financial markets.
Yield Curve
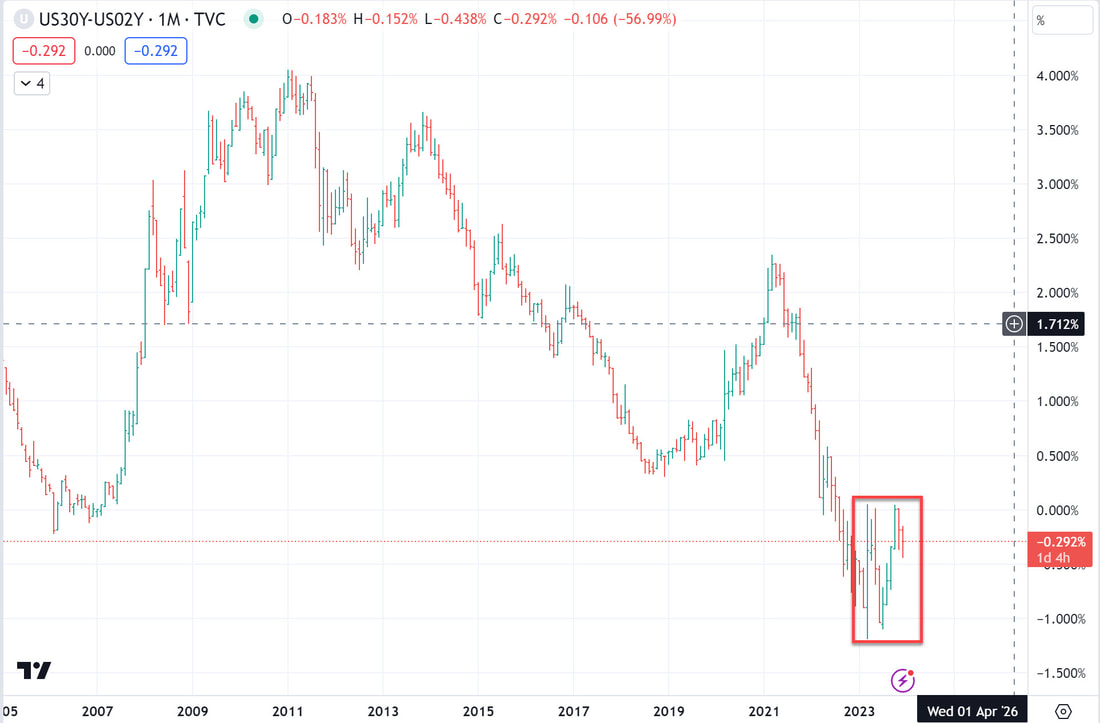
While the yield curve remains inverted, which many consider to be an indicator for recession, the trend lower has ended and the market has entered into a trading range as the outlook for the economy remains highly uncertain. Since the 1970s, the yield curve has tended to be mean reverting as the Fed engaged in counter-cyclical monetary policy, however prior to that period there were several occasions where the yield curve remained inverted for prolonged periods of time. In today's highly leveraged economy an inverted yield curve puts pressure on the banking system and raises the cost and availability of credit for many enterprises. This disinflationary force serves to offset the stimulative effect from the recent drop in interest rates and rally in risk markets.
In a traditional business cycle as the economic expansion enters the later innings, inflation increases, the central bank raises interest rates, spending decreases, and the demand for credit decreases. When unemployment begins to rise it puts downward pressure on incomes and spending which causes the economy to contract. If prices fall as demand falls then inflation will decrease and the central bank will be able to stop raising interest rates. This is where we are currently in the cycle, however it is unclear if the economy will contract warranting the Fed interest rate cuts that are priced into the market.
In a traditional business cycle as the economic expansion enters the later innings, inflation increases, the central bank raises interest rates, spending decreases, and the demand for credit decreases. When unemployment begins to rise it puts downward pressure on incomes and spending which causes the economy to contract. If prices fall as demand falls then inflation will decrease and the central bank will be able to stop raising interest rates. This is where we are currently in the cycle, however it is unclear if the economy will contract warranting the Fed interest rate cuts that are priced into the market.
10-year US Treasuries
The inverted yield curve is a function of two contrary forces taking place within the treasury market. As we have already reviewed the market persistently expects the Fed to lower interest rates despite a resilient economy which has kept short-term rates in a range. On the long-end of the curve we have seen an upside breakout from the 40-year secular trend lower in yields. This breakout has now seen yield bogey buyers step into the market initially when yields hit the 2018 highs, again when they hit the 2008 high, and most recently at the 5% yield level. The reasoning these buyers rely on are that high debt levels continue to exert a disinflationary force on the economy, equities are overvalued, and positive real yields offer an attractive risk-reward opportunity. However, each time these buyers enter the market they encounter selling from foreigners, increased Treasury issuance, and fast money selling who reason that we have entered into a new inflationary cycle and yields will be "higher for longer."
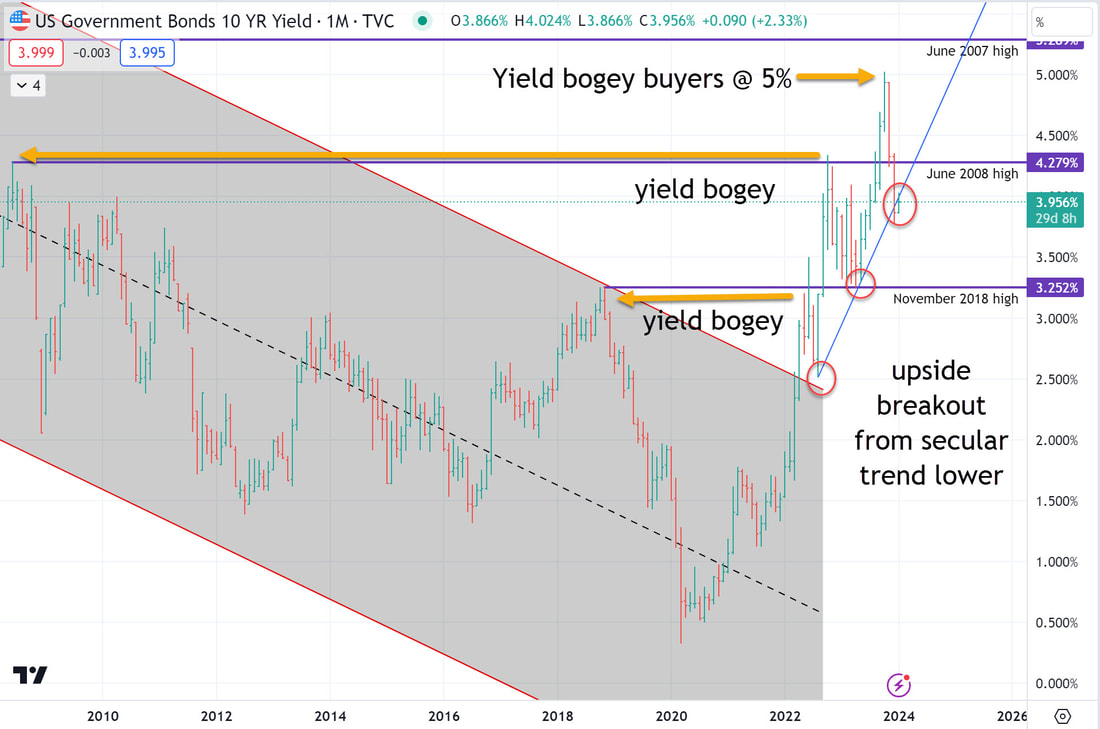
The balance of these forces, as opposed to lower demand for long-term credit appear to be the causes behind the inverted yield curve. While we have persistent expectations for higher unemployment and lower inflation, we have yet to realize a decreased demand for long-term credit that would happen when the economy meaningfully slows.
Crude Oil
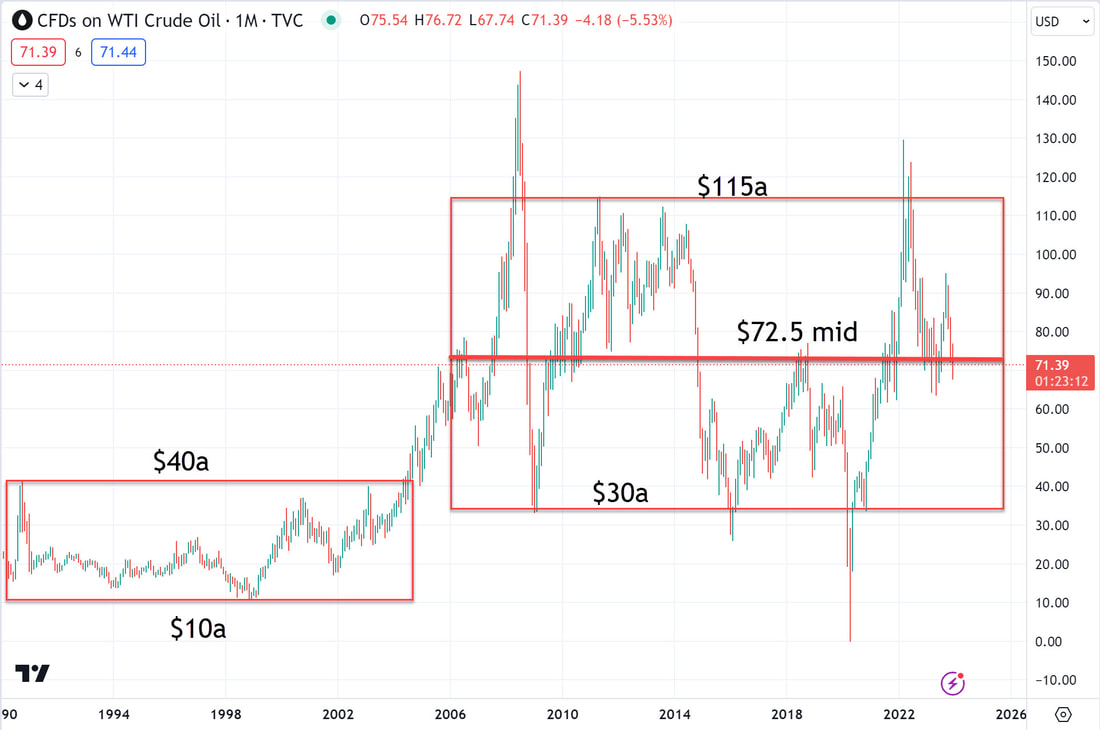
Prior to the GFC crude oil spent many years in a narrow trading range between $10 and $40 per barrel. Since the GFC, that range has expanded and volatility has increased meaningfully as credit crises and a global movement away from hydrocarbons threatened demand for crude and depleted reservoirs and a lack of capex threatened the supply of crude.
This volatility has made crude a less reliable indicator of the strength of the global economy. If we zoom into a daily chart of crude we can see that the market action over 2023 was mostly working off the excess from the exuberant run up in prices in early 2022. We recently saw a failed upside breakout attempt and crude has returned to the range low making trade location favorable as we enter the year.
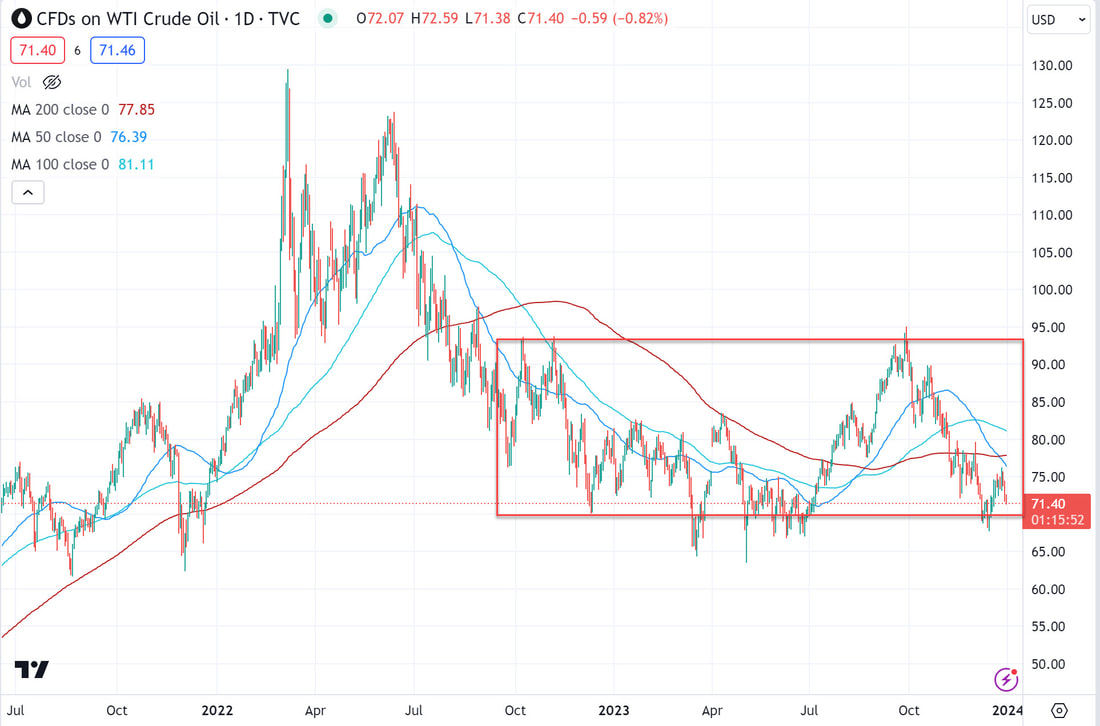
There is uncertainty around a potential downside breakout which would likely come if growth meaningfully slows more than expected in 2024. Trade location affords a favorable risk-reward proposition with a stop on a downside breakout that finds acceptance and continuation. A failed downside breakout would increase the probability of a return to the trading range and exploration of the upper bounds of that range. The message from this picture is a market that is short which aligns with the prevailing expectations for a slowdown in growth and rate cuts.
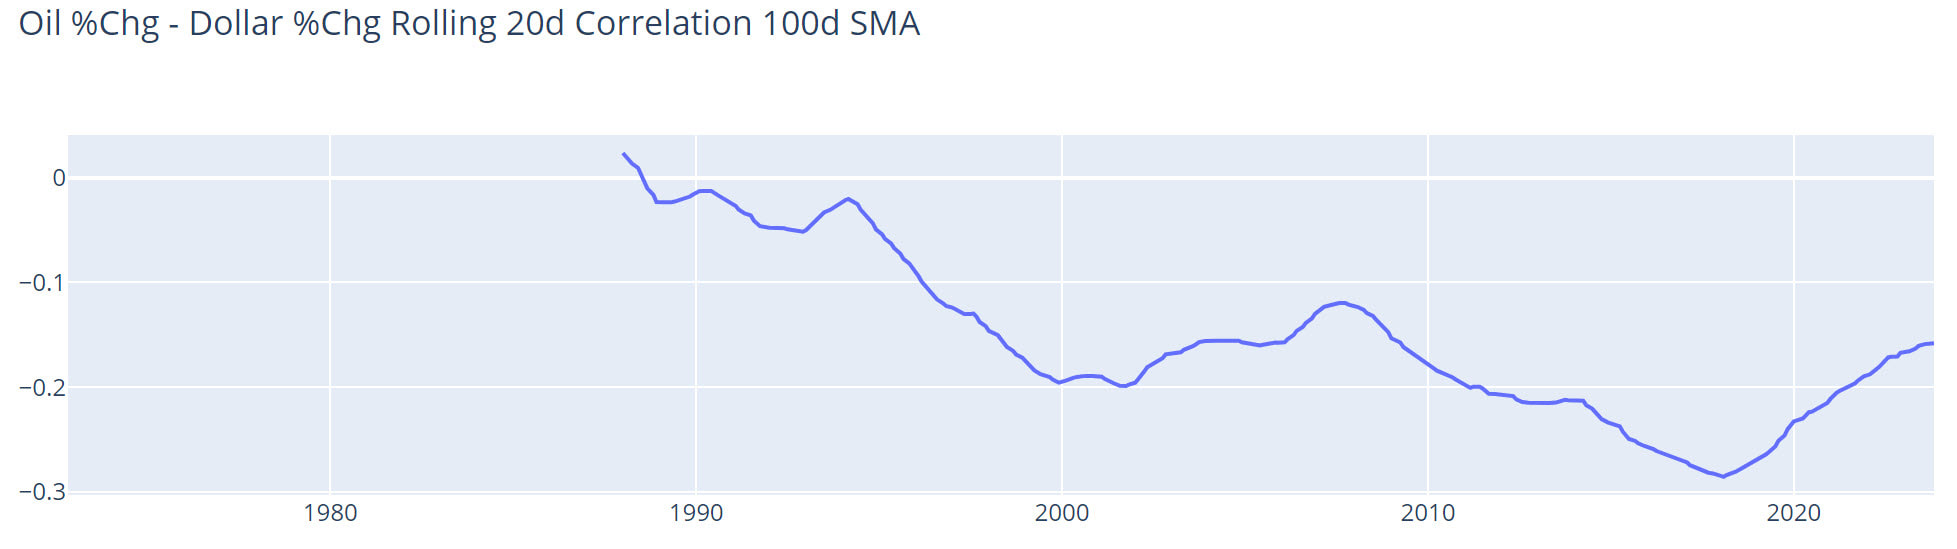
Historically crude has traded with stable correlations to the dollar, interest rates, and stocks. Crude is positively correlated to stocks and yields and negatively correlated to the dollar. Therefore if stocks fall and interest rates continue to move lower, potentially breaking out of the range to the downside, crude could see a downside breakout that finds acceptance and continuation lower. However, if the dollar falls in this scenario it could provide support to crude due to the prevailing negative correlation. For this to happen the correlation between stocks and the dollar would have to move from negative to positive.
Historically crude has traded with stable correlations to the dollar, interest rates, and stocks. Crude is positively correlated to stocks and yields and negatively correlated to the dollar. Therefore if stocks fall and interest rates continue to move lower, potentially breaking out of the range to the downside, crude could see a downside breakout that finds acceptance and continuation lower. However, if the dollar falls in this scenario it could provide support to crude due to the prevailing negative correlation. For this to happen the correlation between stocks and the dollar would have to move from negative to positive.
The Dollar
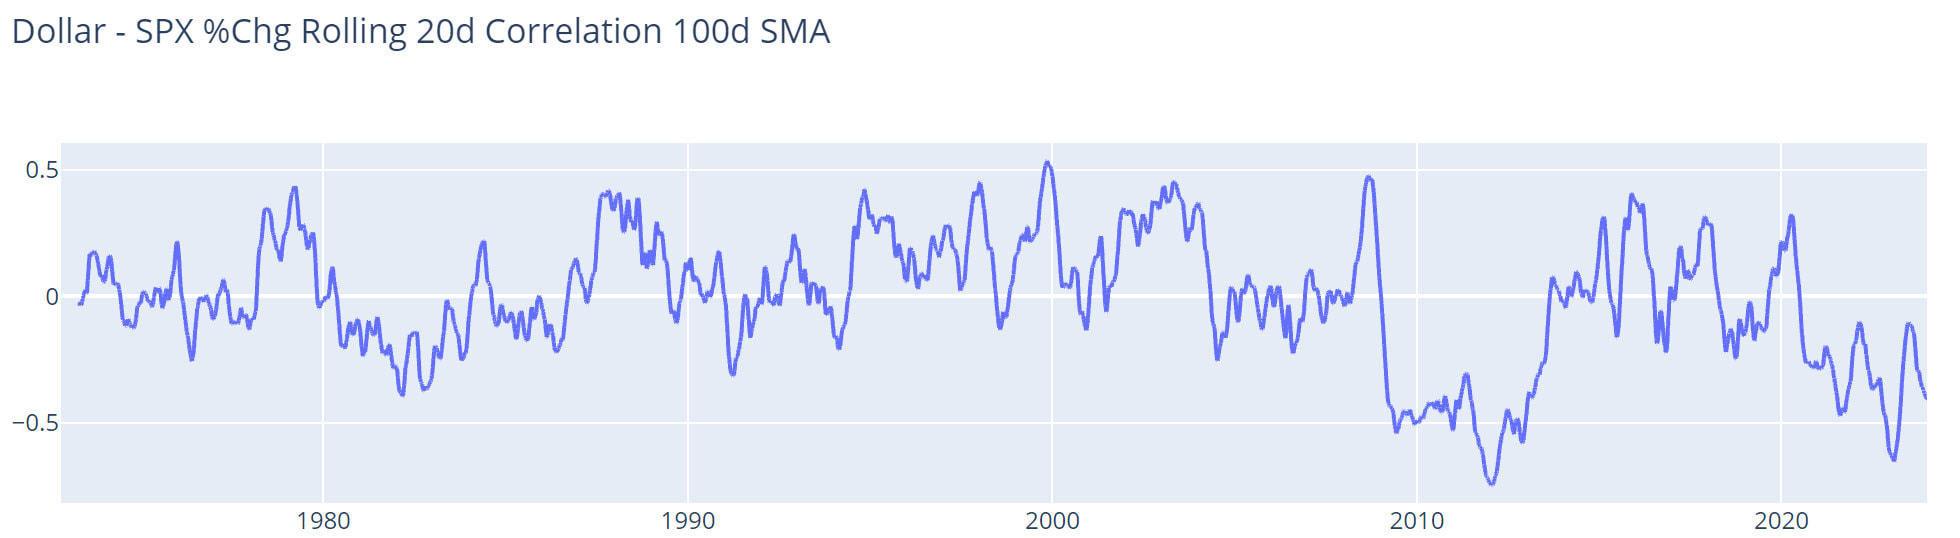
The negative correlation between the dollar and stocks is not as persistent as the negative correlation between the dollar and crude as there have been alternating periods of positive and negative correlation. Since the GFC a lower dollar has tended to be positive for the stock market until the BOJ took action in 2014. After that the correlation moved into positive territory but has recently moved back into negative territory after the COVID pandemic. When the Fed is easier than other developed market central banks the correlation between stocks and the dollar tends to be negative, however when they are tighter the correlation tends to be positive. The recent tightening cycle, while it did see a large rally in the dollar did not see the correlation return to positive territory.
As we head into 2024 the outlook for the economy is highly uncertain but the importance of the dollar in the global markets is increasing. Since the deleveraging cycle that was kicked off by the GFC has been exerting deflationary forces on the global economy developed market central banks have been engaged in a race to the bottom for interest rates and extraordinary monetary policies to sustain economic growth. Those policies laid the groundwork for the recent inflationary impulse that we experienced in the wake of the COVID pandemic. Whether that impulse has kicked off a new inflationary cycle ending the deflationary cycle from the GFC or if this impulse is transitory is still unknown, however the market action indicates an expectation that the Fed will pursue a monetary policy that is easier than other central banks and an economy that remains resilient.
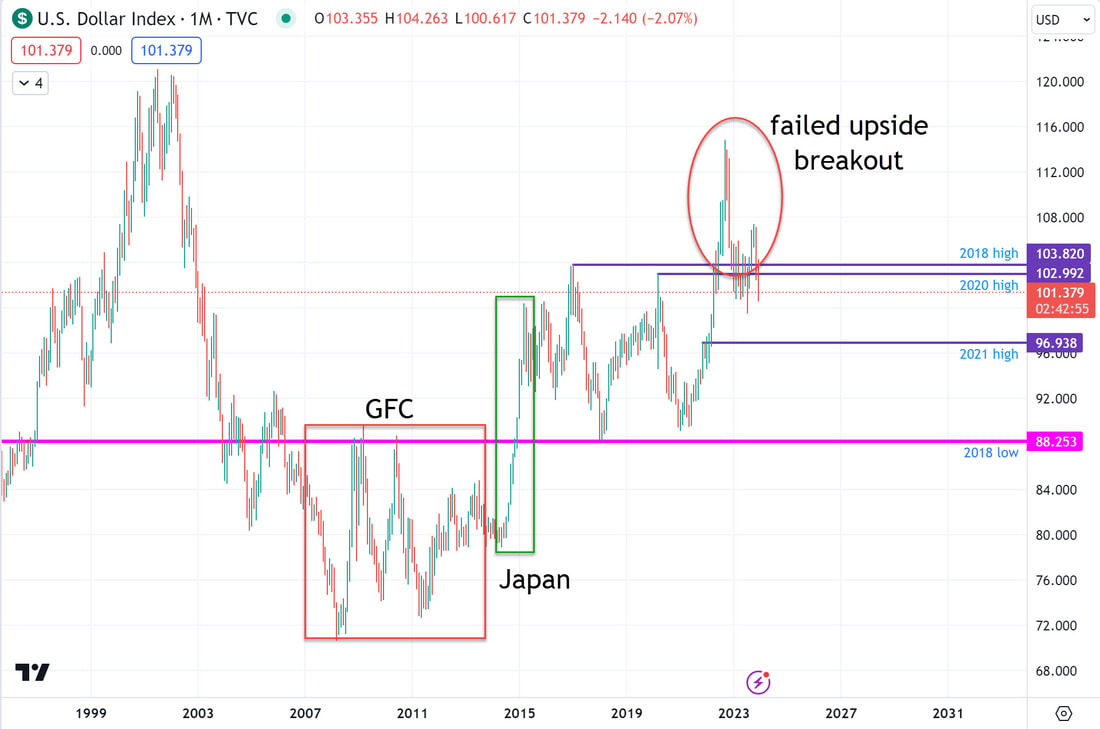
The failed upside breakout in the dollar reveals the persistent expectation that the Fed would not meaningfully increase real interest rates, but keep them relatively low and supportive of the economy, effectively threading the needle and achieving a soft-landing. The ability for policy makers to dodge a credit crisis earlier this year amidst the regional bank panic further increased confidence in this outlook and has kept a bid underneath the dollar but not too much to be harmful to the economy. The US remains the center of global innovation and Europe has many internal constraints that hold it back from challenging the US's global dominance while the BOJ continues its ultra-loose monetary policies which all conspire to keep funds flowing into the USD supporting the economy.
The trading range for the dollar represents equilibrium for US real rates relative to the rest of the world. This range keeps funds flowing into the US supporting the economy and keeps real yields low enough to remain supportive of growth without increasing inflationary pressures. If the dollar moves outside of this range it could indicate that the Fed needs to increase real yields to counteract inflation or that the growth prospects of the US have deteriorated enough to deter foreign investment. It is this later scenario where the correlation between the dollar and stocks would likely turn positive.
The trading range for the dollar represents equilibrium for US real rates relative to the rest of the world. This range keeps funds flowing into the US supporting the economy and keeps real yields low enough to remain supportive of growth without increasing inflationary pressures. If the dollar moves outside of this range it could indicate that the Fed needs to increase real yields to counteract inflation or that the growth prospects of the US have deteriorated enough to deter foreign investment. It is this later scenario where the correlation between the dollar and stocks would likely turn positive.
Equities
Trade location in the S&P 500 is highly risky as price is near the upper end of the recent range. If the market can find upside acceptance and continuation that risk will meaningfully decrease. If it cannot an exploration of the lower end of the recent range is possible. This could take place amidst an economic contraction or failure to achieve a soft landing.
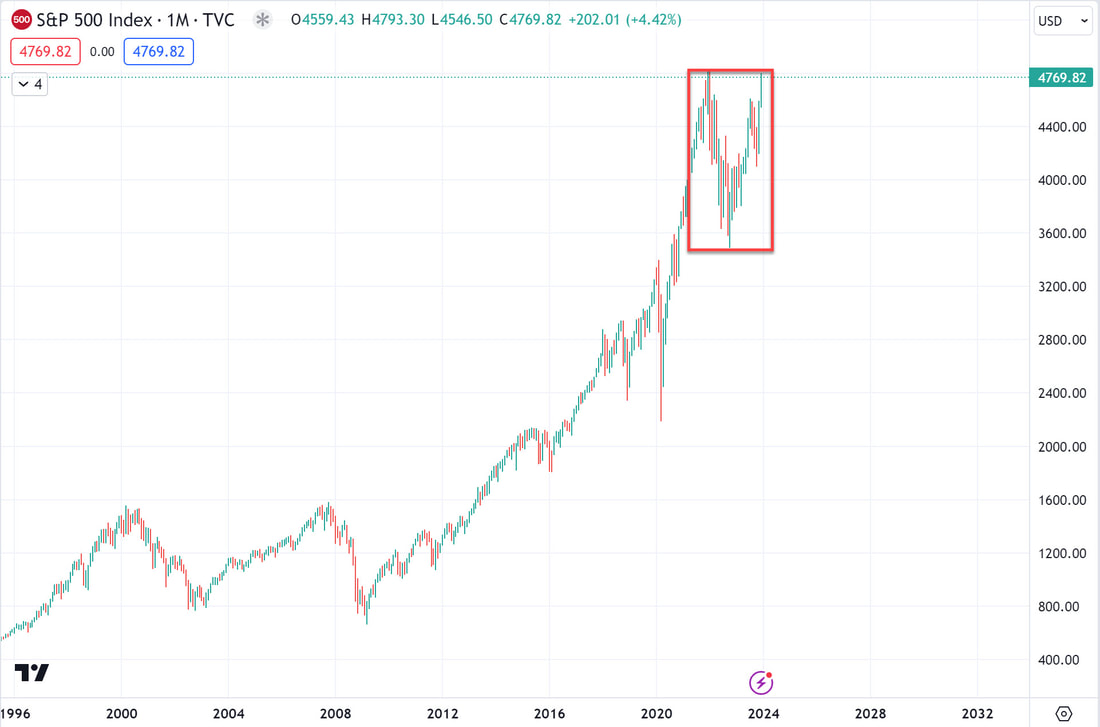
If we zoom into the different market segments we see a divergence between economically sensitive small caps and large cap tech stocks. Small caps are well off the recent highs while large cap tech has a similar trade location as the S&P 500.
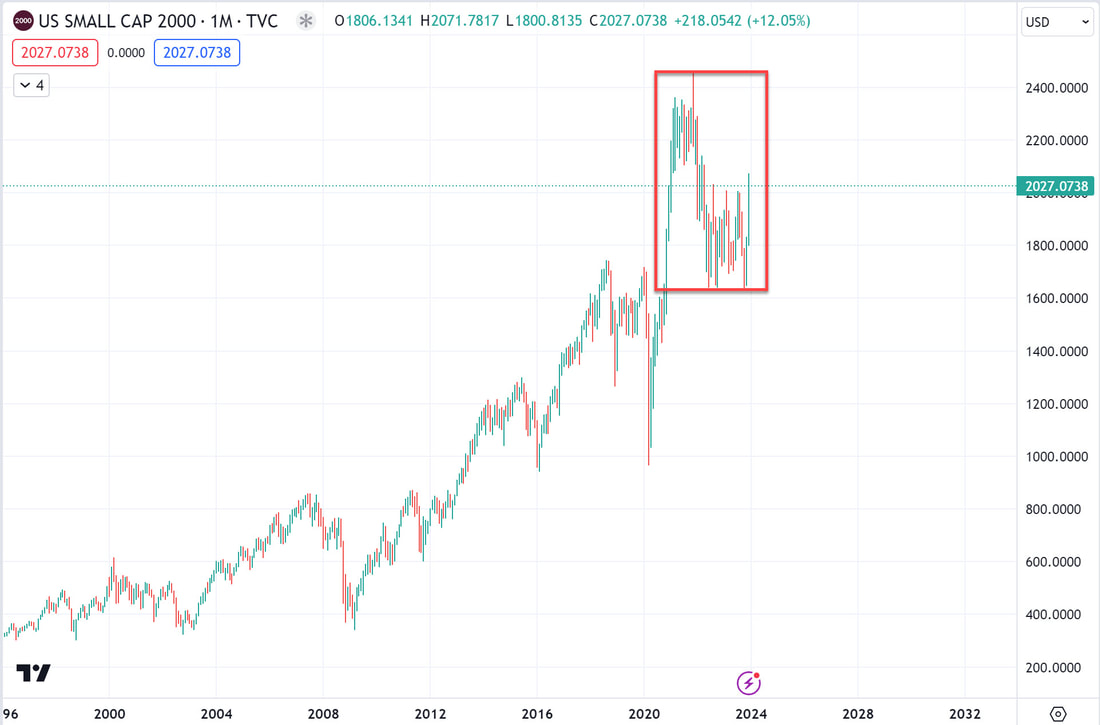
This divergence is representative of the post-GFC regime where economic growth was weak and interest rates were low. Large cap tech is less economically sensitive and disproportionately benefits from lower interest rates due to the longer duration of those business models.
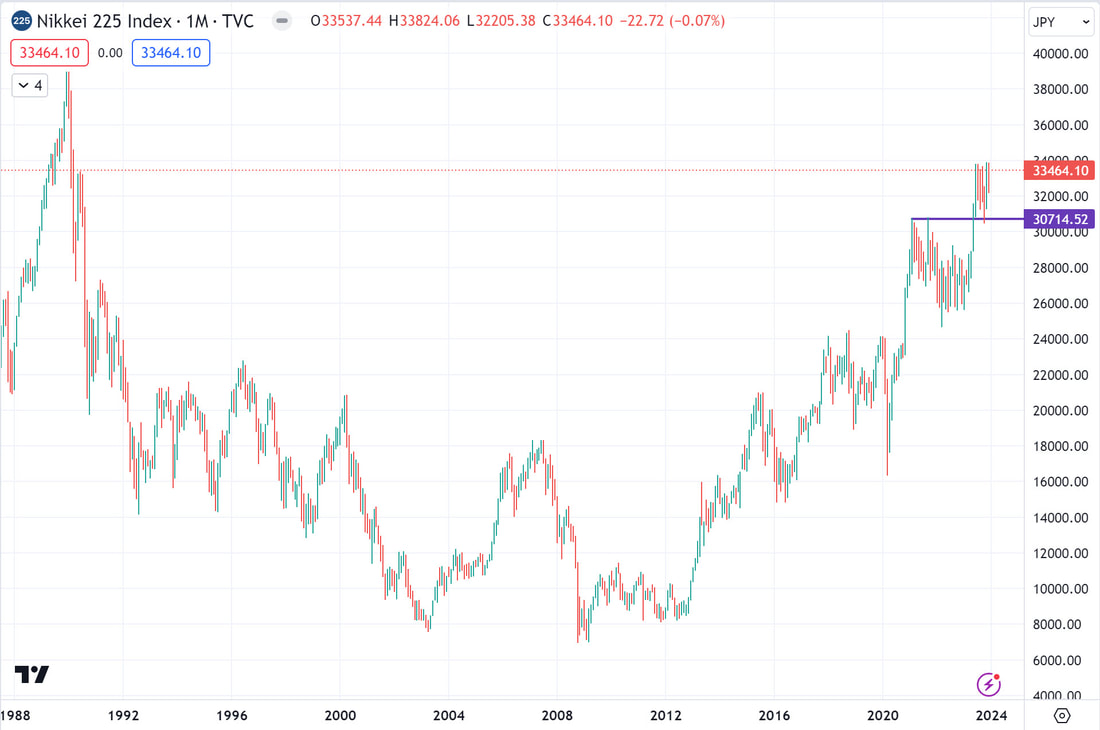
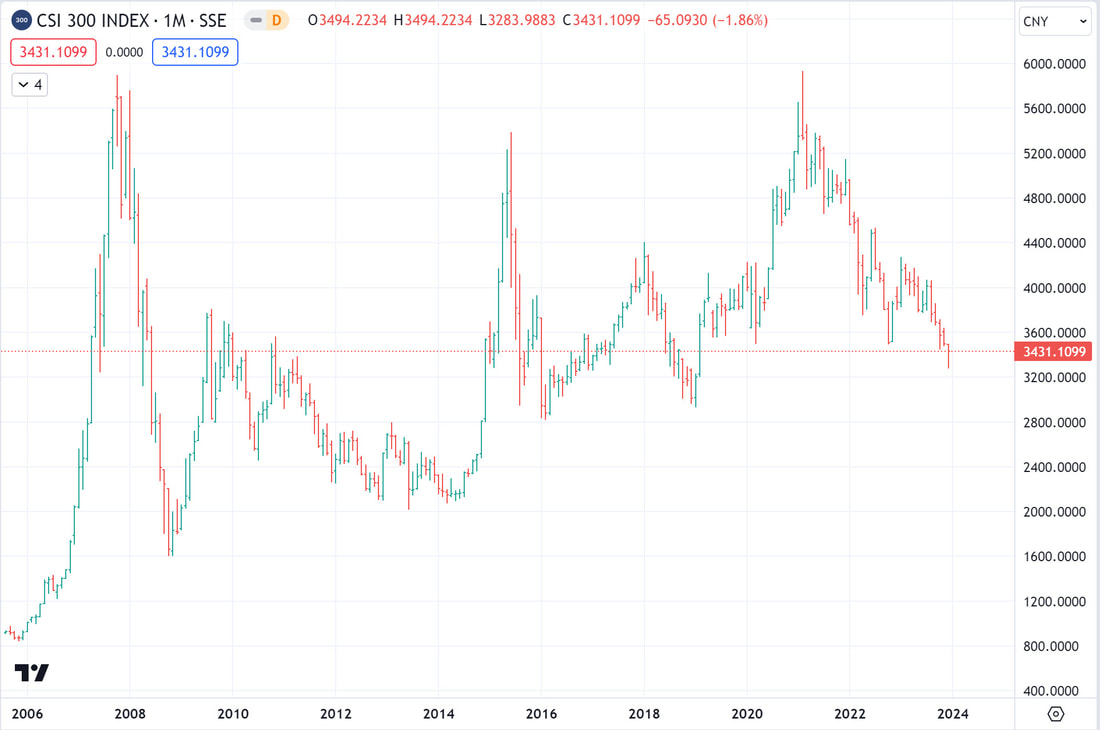
We have seen an upside breakout in Japanese stocks while Chinese stocks are below the COVID lows. These are both reversals of long-held trends where China was the growth engine of the global economy and Japan was mired in a long deflationary cycle. The reversal of these two disinflationary trends are signs that we have seen meaningful change in the global growth-inflation tradeoff.
We have seen an upside breakout in Japanese stocks while Chinese stocks are below the COVID lows. These are both reversals of long-held trends where China was the growth engine of the global economy and Japan was mired in a long deflationary cycle. The reversal of these two disinflationary trends are signs that we have seen meaningful change in the global growth-inflation tradeoff.
Gold
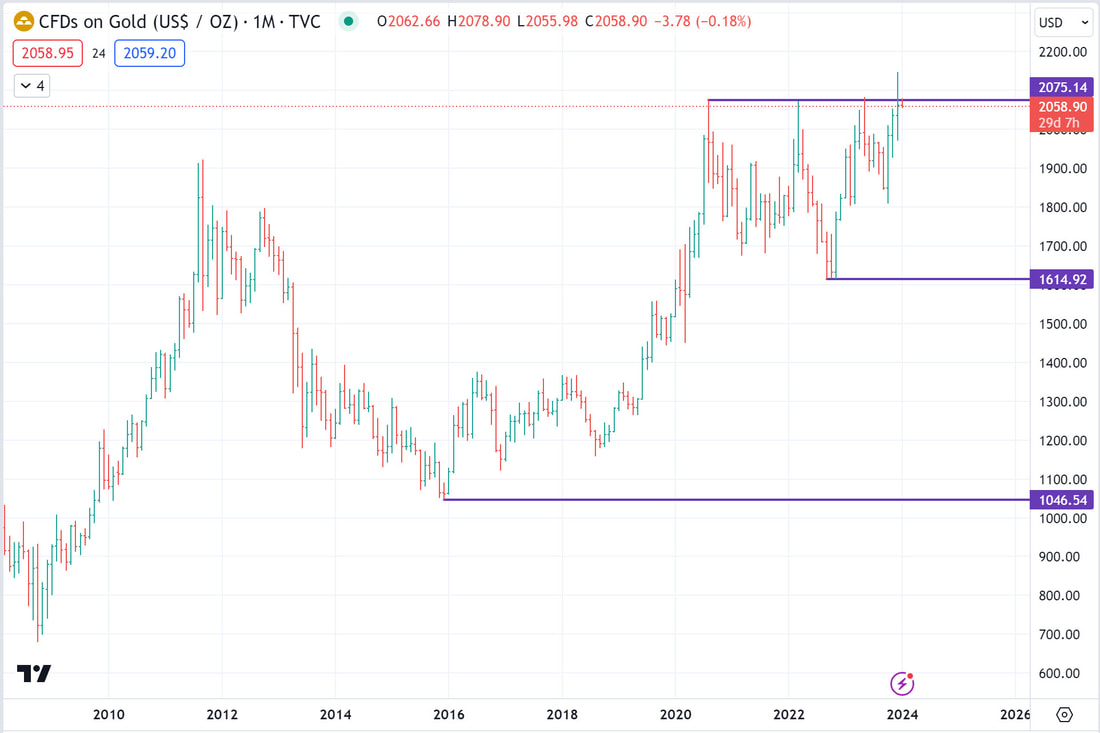
Gold is attempting to breakout to the upside from a 12-year trading range. This is another sign that the message the broader markets are conveying is that the Fed continues to pursue the post-GFC, easy monetary policies despite a historical rate hiking cycle. For gold to find upside acceptance and continuation the dollar will need to fall materially which is another reason why the dollar is an increasingly important signal for the markets and economy.
Conclusions
The primary takeaway from the messaging in the markets is the incongruity of the pricing in the equity and bond markets. The bond market is expecting rate cuts however the Fed will not cut with the equity market where it is. Higher stock prices reduce the odds of Fed easing and this has not been reflected in current market pricing. This is true if we are in a traditional business cycle but also true if we remain in a deleveraging cycle. The Fed has already tightened more than expectations and the only measure that shows they are too tight is the yield curve.
The market continues to set prices based upon the post-GFC, ZIRP regime where the Fed had an asymmetric reaction function; they would lower rates in response to signs of weaker growth but not raise rates in response to higher stock prices. Prior to the GFC and ZIRP the Fed would respond to lower equity prices with rate cuts and higher equity prices with rate hikes. The most important question before the market as we begin 2024 is whether we are in a traditional economic cycle or if we continue in the deleveraging cycle.
The dollar contains the most valuable information related to the question of what type of cycle we are experiencing. An upside breakout in the dollar would signal an inflationary regime, strong US growth, inflation, and the need for higher real rates. A downside breakout in the dollar would signal a continuation of the deleveraging cycle, weak US growth, disinflation, and the need for lower real rates. If yields continue to move lower and stocks begin to move lower the reaction from the dollar will be important to watch. If the correlation between stocks and the dollar moves into positive territory it will signal the Fed is too tight and the economy is much weaker than expected. In this case we would expect to see a downside breakout in crude oil.
One of the most asymmetric risk-reward propositions is the yield curve. In either a traditional economic cycle or deleveraging cycle the yield curve is likely to steepen. Whether from a realization of lower economic growth and rate cuts or from the reversal of these expectations due to stronger growth and inflation the odds are in favor of a steeper yield curve because the inverted yield curve is the only measure that signals the Fed is too tight. We have seen yield bogey based buyers supporting the long-end of the treasury curve based the view that equities are overvalued and a recession is likely. If those views do not pan out we could see a a wave of selling in long-term treasuries. While the odds favor the next move in the yield curve to be steeper, the question of timing remains uncertain as the current inversion would remain in place for sometime.